Frequently Asked Questions
No matching question found...
Could you provide more information about options available in the data management sidebar?
Data management sidebar contains options regarding loading or acquistion of the Human AGEs web server input data.
First section is the Session management. Session is a powerful utility that can save or restore entire interactive map state using session file. At any time, user can use provided options to save the visualization and download it for the backup or sharing. Additionally, there is an option to load a predefined session. It may serve as a start point of the user's own work.
Second section is the User dataset. It contains an option to load custom user dataset from the local hard drive. The acceptable dataset file formats are JSON and CSV. The mandatory attributes of the samples are: sample_id, latitude, longitude. Any other provided attribute is possible to visualize using map layers. These include genomic, anthropological or archeological attributes, that can be represented as either non-unique text (e.g. haplogroups; sex; development stage; burial type), vector of comma-separated frequencies summing up to 1 (e.g. 0.25,0.25,0.5) or 2D vector of cartesian real number coordinates (e.g. 4.56,10.1). We prepared two example files which can be a basis of either JSON dataset file or CSV dataset file.
Database queries section provides an option to explore and visualize publicly available genomic and archeogenomic data. Users can obtain datasets from a chosen dataset.
All imported data appear in the Loaded datasets sections. Here users can explore metadata of the datasets, sample them or remove them.
The website's style after the page loaded seems incomplete - icons are missing and fonts look out of place.
For optimization of the website's loading time we use CDN services (Content Delivery Network), which host and provide most of the used third-party static content such as JSON scripts, fonts and icons.
Although CDNs are designed to handle heavy internet traffic, it may occasionally happen that a connection to the provider couldn't be established.
As the neccessary content can't be downloaded by the user's browser, it results in missing content on a client-side.
Fortunately, such pitfalls do not last long. Because of that we encourage You to ignore the issue and refresh or reconnect to the visited page once again.
This problem tackles mostly first-time visitors, because, once acquired, static content Swill be cached on Your local computer by the browser and can be used again in the future.
I am Firefox user and the interactive map doesn't load up properly. In the browser console I get "WebglAllowWindowsNativeGl" and/or "FEATURE_FAILURE_WEBGL_EXHAUSTED_DRIVERS" error.
This error could occur due to recent Firefox or hardware drivers update that happend on Your system, which may interfere with the functionality of WebGL - the utility that partialy runs interactive map.To fix it you need to change a "webgl.force-enabled" setting to "true" at Firefox about:config page.
This problem has been also described at Mozilla Support page.
Heatmaps are not visible. In the browser console there is a "WebGL context was lost" warning.
This error is due to the extensive usage of your GPU by multiple applications. Please make sure that you are running only one instance of the interactive map in your browser at the same time. You may also close any GPU dependent programs run locally on your computer and any other map-based web applications. Also, simple reloading the page often solves the issue.
For more in-depth explanation, please visit this support page.
Sometimes when I browse the interactive map I encounter a case, where boundaries of two clusters overlap and a feature from the first cluster lays in a boundary of the other. How is that possible? Shouldn't the second cluster include that feature?
The sample cluster is created by grouping together unassigned samples laying within given radius from another sample, which was randomly picked to be cluster center. Cluster boundaries are vizualized as convex hull of its samples positions.
The important thing to note is that distance determination happens on a globe, while the result is shown on a flat plane. The distances distortions that result from the sphere on the plane projection may in a consequence lead to misleading boundaries visualization.
For example, on the pictures below you can see two regions laying on the globe (left), and the same regions projected to the plane (right). The world coordinates of each vertex are exactly the same on both pictures.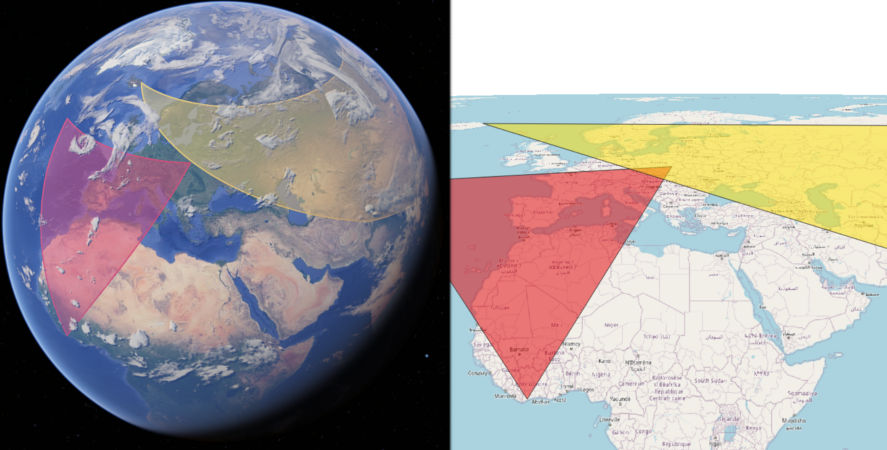 To prevent such situations, you can use region clustering which is invariant on data and map view changes. You could also try to shuffle your dataset samples, which may change origin positions of the clusters to more favorable ones.
In the future, we will consider adding an option to change type of map projection and to visualize data on the globe.
To prevent such situations, you can use region clustering which is invariant on data and map view changes. You could also try to shuffle your dataset samples, which may change origin positions of the clusters to more favorable ones.
In the future, we will consider adding an option to change type of map projection and to visualize data on the globe.
How can I make HumanAGEs interactive map run faster?
Human AGEs interactive map is a web-hosted application, which runs most calculations on the client. Because of that, its performance is limited by the user's hardware. To optimize your vizualizations, there are several available options.
First, you may consider limiting your vizualization to a certain region if possible. It can be achieved by loading a dataset filtered to the given region, as it was shown in this example.You can also load whole dataset and use map management options to cluster samples to regions and filter the latter to only desired ones, as it was shown here.
Second, you can randomly sample large datasets by a given fraction. This way you can comfortably work on a smaller subset before switching to the whole for a final visualziation.
Lastly, if you experience noticeable delays when shifting timeline interval, you can disable smooth transition by ticking "event only on release" checkbox in the time filter options. It will make the map update only when the timeline interval handle is released.
OpenLayers geographical library is about to be upgraded with multithreading capabilities in the future. We plan to utilize it on the release and we belive it will give a significant performance boost for the whole application.